

(Credit: Ben Sutherland Flickr)
It’s widely regarded as fact that most teams will be at an advantage when playing games on home turf. It’s a trend that is common in pretty much all leagues – the majority of wins do in fact come from those teams playing at home.
The Premier League is a great example of this. In the 2018-19 season, these were the stats for home wins, away wins, and the draw:
- Home win = 48%
- Draw = 19%
- Away wins = 34%
- Goals per match home = 1.57
- Goals per match away = 1.25
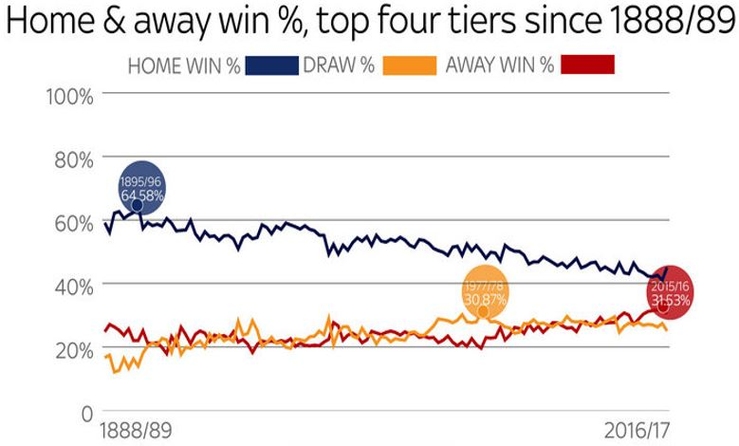
These trends have been going on for decades now having occurred every season since 1988, but in an interesting study from Sky Sport, it was found that these trends are actually becoming less impactful.
Their research started with a high of 64.58% of home wins in 1895, but the numbers have slowly and steadily reduced since then. Whilst they aren’t quite at their lowest point right now, they are declining, which is interesting to see.
Here is the graphic taken from the Sky Sports website:
Regardless of this decline, the fact of the matter is that there are more home wins than away wins as things currently stand, which means that there is a clear advantage for the team that is playing at home over the course of the season.
This stat is actually accentuated at an International level, where over 50% of games result in home wins.
Elite Leagues
![]()
Given that the top leagues in the world are often dominated by a handful of teams much more powerful than the rest, it’s reasonable to wonder if the statistics still apply.
We can get a huge amount of data from the Premier League so we though that this would be a good place to plot our data for our research. The league has only been in existence since 1992 as well, which makes the data a little more manageable.
What we found from our research is that the Premier League has been very stable in terms of home win rates since 1992. It fluctuates each year, but it’s never seen more than a 10% swing which makes it very steady.
| Season | Home Win | Draws | Away Win |
|---|---|---|---|
| 2018-19 | 48% | 19% | 34% |
| 2017-18 | 46% | 26% | 28% |
| 2016-17 | 49% | 22% | 29% |
| 2015-16 | 41% | 28% | 31% |
| 2014-15 | 45% | 24% | 30% |
As you can see, whilst there have been some swings, it clearly shows that the home win is still king.
What Does This Mean for the Punter?

The fact that home wins happen more often than a draw or an away win should be treated as a reference point and nothing more. You really need to do your homework on each team before then being able to work out the true advantage a home team will have over an away team.
We can do this by taking into account the goals scored and conceded at home, and then try to work out a positive or negative score line. The higher the positive number you get for each team, the stronger their chances of winning at home. You can’t just apply a blanket industry percentage to all games, because Man City are going to be better at home than say, Sheffield United who had just been promoted.
We can use a pretty simple equation to work this out:
Home advantage = (home goals – conceded home goals) / number of matches per season
We will work through each team from the 2018-19 season and see if some teams are stronger at home than others and more importantly, by how much.
| Team | Average Home Advantage |
|---|---|
| Man City | 2.37 |
| Liverpool | 2.37 |
| Tottenham | 0.95 |
| Chelsea | 1.42 |
| Arsenal | 1.37 |
| Man United | 0.37 |
| Wolves | 0.42 |
| Everton | 0.47 |
| Leicester | 0.21 |
| West Ham | 0.26 |
| Watford | -0.10 |
| Crystal Palace | -0.36 |
| Newcastle United | -0.05 |
| Bournemouth | 0.26 |
| Burnley | -0.42 |
| Southampton | -0.16 |
| Brighton | -0.47 |
| Cardiff City | -0.89 |
| Fulham | -0.74 |
| Huddersfield | -1.10 |
Let’s break this down by starting with Man City and Liverpool who are at the top. This should come as little surprise really given that these two teams were able to finish 1st and 2nd by some distance. On average they were scoring 2.37 goals more than their opposition at home and totally dominating.
The top 5 are all as expected really, although Tottenham are the weakest of the bunch here with just a 0.95 average home advantage. That said, this data could be skewed somewhat as they played most of the season at Wembley while their new ground was being built, so they weren’t really playing at ‘home’.
A big shock running these numbers was that of Manchester United, who were down at just a 0.37 goal advantage at home. Old Trafford is considered to be an absolute fortress and has built an intimidating reputation over the years. Their home ranking int the last year of the Sir Alex Ferguson era in 2012-13 was up at 1.37, but you would have to say the ground is no longer the impenetrable bastion it once was.
When you look at the numbers for Burnley and Watford – who are known to have notoriously tough grounds for visiting teams – it shows they are both in the negative with no home ground advantage at all. Bottom ranked Huddersfield’s negative advantage is to be expected, any team down the bottom of the table is unlikely to display much of a home advantage, although there was one occasion in 2015-16 when Newcastle United were relegated with a positive home advantage, but this is the only time that has happened.
How can This be Applied to Betting?

Well it can dispel a few myths about how strong certain teams really are at home. We’ve spoken about Watford and Burnley already, but Stoke were another team that were heralded for being great at home, when the stats actually show that they weren’t much better than par – and stats don’t lie.
Commentators and pundits like to talk up grounds as being fortresses to create drama, so some teams gain a reputation for being strong at home when the data would suggest otherwise. Knowing this means you won’t get sucked into the ‘story’ and can make more informed bets.
What we really like to do with this data is take teams on the handicap market, and in particular the Asian handicap. This data allows you to see the true advantage that a team is getting at home, and you could flip this around to create a similar table for when teams play away from home as well. The likes of Wolves and Everton would be good straight up picks to win at home, but the likes of City, Liverpool, Chelsea, Arsenal and even Tottenham would be good teams to target on the handicap market.
Other Contributing Factors

Of course these stats only tell half the story. They are an average and don’t take into account who is playing who or any other factors that could have an impact on how each team performs.
1) The first of these are the fans. If there are 50,000 very vocal fans all backing a side to do well, there is no doubt that the players will feed off this. They are all pulling for the same thing and players know that if they do well they will make the fans happy. A ground with a smaller capacity or that is half empty might not have quite the same impact.
It’s not necessarily just the size of the ground either, it’s also about the atmosphere that is created. Some of the smaller grounds where the players are close to the fans can be very intimidating for opposition players, almost like adding a 12th man to the game.
2) Another factor that plays a big part are past results at the ground. If a team is on a roll playing at home they will have the fans on their side and be confident in keeping that run going. Sometimes this sort of momentum is overlooked in football betting and can be ignored when you include away results as well. But the fact is that most teams play very differently at home than they do away, so the data that you take has to be from the home results and the previous games that have been played there.
3) Finally, we have to mention the ref. Whilst referees are supposed to be totally unbiased, it’s common knowledge that the home team tends to get the rub of the green with most decisions that are borderline. This is largely down to the fact that fan interaction puts the referees under extreme pressure to please them, so their input can play a big role in a referee’s decision, albeit subconsciously.
There have been several studies that would back up this statement as well, showing that home teams get awarded more ‘50/50’ decisions than the away teams, especially when it comes to penalty decisions that then in turn into goals.